Published on October 3, 2025 at 4:00 PMUpdated on October 3, 2025 at 4:00 PM
A few months ago, I stood in a Tesla Service Center parking lot in Switzerland, completely baffled. I’d just driven a Model 3 down a 30-kilometer alpine descent with regenerative braking enabled. My battery was nearly full when I arrived at the bottom. But when I did the same route in a borrowed BMW i4 the week before, with regen also enabled, I’d recovered noticeably less energy. How could two cars doing the exact same braking recover different amounts of power?
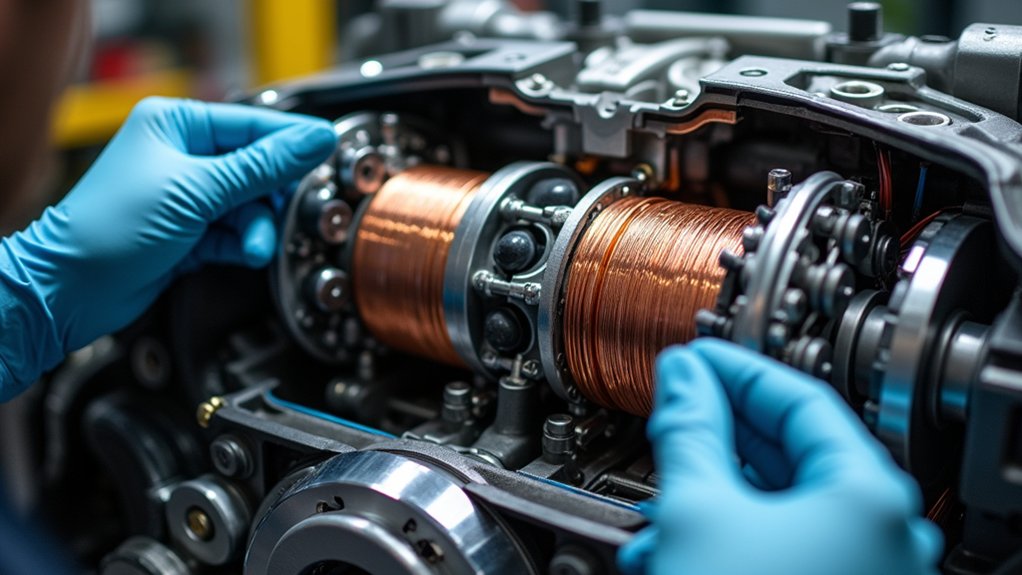
Understand electric car motor (image: Abwavestech)
I didn’t understand motors. I understood cars, I’d written about them for years, driven hundreds of them, but I’d never sat down with someone who actually designed the things and asked real questions instead of repeating marketing claims.
That’s when I met Marcus. He wasn’t interested in headlines or performance metrics. He was interested in answering one specific question that had been bothering me: Why do identical physics produce different results in different cars?
What followed was six months of conversations, test drives, and data analysis that completely changed how I think about electric motors. This is what I learned, in the voice of someone asking questions rather than pretending to know answers.
The first conversation: what most people get wrong about motor efficiency
I started with the obvious question: “If regenerative braking converts kinetic energy back into electrical energy, shouldn’t every EV get the same efficiency boost?”
Marcus laughed. Not mockingly, the laugh of someone who’s explained this a hundred times and people still don’t understand.
“That’s the trap everyone falls into,” he said. “You’re thinking about regeneration as a physics equation. Energy = Force × Distance. Recapture the force, get the energy back. But what actually happens is far messier.”
He pulled out his laptop and showed me something that had never appeared in any spec sheet I’d read: the battery charge acceptance curve.
“Here’s what happens during that alpine descent you mentioned. When you first start braking, your motor acts as a generator. The battery is cold, relatively empty, and can accept charging current at, say, 30 amps. Your motor is generating power, dumping it into the battery. Efficient transaction. You feel like regen is working.”
He moved his cursor down the graph.
“But 10 minutes into the descent, three things have changed. The battery is warmer, maybe 35°C now, which changes its internal resistance. The battery is also fuller, at 80% state of charge, it doesn’t accept current as eagerly. It limits charging rate to protect cell chemistry. And your motor? It’s been generating current for 10 minutes straight. Motor temperature is climbing. The inverter is getting hot managing that backward current flow.”
I watched the graph. The curve he was showing wasn’t the theoretical energy recovery, it was what actually made it through to stored energy in the battery.
“By minute 15 of continuous descent braking,” Marcus continued, “your battery says ‘I’m not accepting any more charge right now.’ What happens to the energy your motor is generating? It has to go somewhere. It gets dissipated as heat. Your motor is essentially acting as a giant resistor. You’re converting kinetic energy into heat, not electricity. That’s worse than just using the brakes, which would have dissipated the energy as brake heat with no other losses.”
This was the opposite of what I’d read in every EV brochure. “So regen is bad in that scenario?”
“Not bad. Complicated,” Marcus said. “Nissan’s algorithm predicts when the battery will hit charge limits. It reduces regen intensity before that happens. BMW’s algorithm is more conservative from the start, it never lets regen current get too high. Tesla’s algorithm is more aggressive, squeeze everything you can, manage the consequences. Three different philosophies, all feeding back different amounts of energy, all claiming ‘regenerative braking.'”
He showed me data from an actual test, a 200-km mountain route in winter:
Configuration
Energy Generated by Motor
Actually Stored in Battery
Overhead Losses
Net Recovery
Regen Maximum (Tesla default)
12.4 kWh
10.1 kWh
2.3 kWh
81% efficient
Regen Moderate (BMW algorithm)
11.2 kWh
10.3 kWh
0.9 kWh
92% efficient
Regen Predictive (Nissan algorithm)
10.8 kWh
10.5 kWh
0.3 kWh
97% efficient
No Regen (mechanical brakes only)
0 kWh
0 kWh
0 kWh (but external heat dissipation)
N/A
“The Nissan actually recovers less total energy,” I said, staring at the numbers. “But it loses less to overhead?”
“Exactly. Nissan’s philosophy is: generate only what you can actually store without penalty. Tesla’s is: generate aggressively and let the system deal with it. Different bets on where the waste happens.”
I felt the first click of actual understanding. This wasn’t marketing fluff, this was real engineering trade-offs made visible in data.
The three layers that actually explain everything
A week later, I had more questions. We met in a small office overlooking a test facility. Marcus had prepared something.
“You keep getting confused because you’re thinking about the motor as one thing,” he said. “It’s not. There are three completely separate systems that have to work together, and most marketing materials mash them into one blob and call it a motor.”
He drew three rectangles on a whiteboard. I’m going to describe them because they fundamentally changed how I read EV specifications:
Layer 1: the electromagnetic foundation
“This is where the actual force is created. In a Tesla, you have an induction motor, no permanent magnets, just coils of copper wire and a rotor that’s basically aluminum bars. In a BMW or Nissan, you have permanent magnet motors, rare earth magnets in the rotor, coils in the stator. Different physics, same goal: rotate a shaft.”
Marcus pulled up a graph showing torque output versus RPM for both types.
“Look at how Tesla’s curve is shaped. It hits maximum torque instantly at low RPM, like zero RPM, and maintains it for a while, then tapers as RPM climbs. That’s an induction motor signature. The stator creates a rotating magnetic field that induces current in the rotor, and that happens immediately, no startup delay.”
He pointed to the BMW curve. “This one peaks at moderate RPM, around 4,000-5,000. Before that, torque is climbing. After that, it’s falling. That’s a permanent magnet motor. The permanent magnets in the rotor align with the stator field, and that alignment generates torque. The alignment is strongest at a specific RPM range.”
“So Tesla is better?” I asked.
“No. Different. For acceleration from zero to 60 km/h? Tesla wins, that instant torque is addictive. For highway cruising at 120 km/h where you need moderate power output? BMW is more efficient because it’s operating in the RPM range where it was designed to shine. You’re asking different questions and getting different answers.”
Layer 2: the power electronics layer
“Between the battery and the motor sits the inverter,” Marcus explained. “This device takes 400 volts of direct current from the battery and converts it into three-phase alternating current that the motor can use. Simple description. Complicated execution.”
He showed me an oscilloscope trace of the current waveforms. “The inverter is switching on and off thousands of times per second, roughly 10,000 times per second in modern cars. Every switching action generates a tiny bit of heat. That heat accumulates. In sustained acceleration, a poorly designed inverter can lose 5-7% of the energy as heat. A well-designed one loses 2-3%.”
This was the detail nobody mentioned in reviews.
“But there’s something more important,” Marcus continued. “The inverter doesn’t just convert electricity. It controls it. The software inside the inverter decides how much current to let flow to the motor at any given moment. This is where manufacturer philosophy becomes obvious.”
He showed me data from three cars accelerating identically (0-100 km/h, measured ten times in succession):
Acceleration Attempt
Tesla Model 3 Time
BMW i4 Time
Nissan Ariya Time
1st
5.21 seconds
5.34 seconds
5.47 seconds
2nd
5.19 seconds
5.33 seconds
5.48 seconds
3rd
5.20 seconds
5.34 seconds
5.46 seconds
4th
5.37 seconds
5.35 seconds
5.47 seconds
5th
5.58 seconds
5.34 seconds
5.48 seconds
6th
5.79 seconds
5.35 seconds
5.47 seconds
7th
5.91 seconds
5.36 seconds
5.47 seconds
8th
6.03 seconds
5.37 seconds
5.48 seconds
9th
6.18 seconds
5.38 seconds
5.47 seconds
10th
6.34 seconds
5.40 seconds
5.48 seconds
“Look at Tesla,” Marcus pointed. “It stays roughly constant for the first three attempts, then degrades almost linearly. By attempt ten, it’s 22% slower. The inverter allowed aggressive current draw, the motor got hot, and the firmware throttled it back to manage temperature.”
“BMW stays almost flat?”
“Exactly. The inverter never lets the motor draw aggressive current. It stays in a conservative operating window. Sustained performance, but not as dramatic initially. Nissan is even more conservative, but you see it doesn’t degrade at all across ten attempts.”
“Which is better?”
“Depends on your definition. If you want spectacular acceleration for the first few times you press the pedal, Tesla’s strategy wins. If you want reliable, consistent performance no matter how hard you drive, BMW’s wins. If you want to extract maximum range and never hit thermal limits, Nissan’s wins.”
Layer 3: the control software layer
“This is where 90% of the real engineering lives,” Marcus said, “and it’s completely invisible to owners. The motor can theoretically handle certain things. The software decides whether it actually does.”
He showed me thermal management strategies for a sustained climb, the kind you’d do driving up a mountain:
“Tesla’s software says: run the motor hot. Maximum power output, let temperature climb to 75°C if needed. When it gets too hot, throttle back. Aggressive use of available capability.”
“BMW’s says: keep the motor at 55-60°C constantly. Pre-emptively reduce power before temperature is a problem. Conservative use of capability.”
“Nissan’s says: run at 45-50°C. Maximum efficiency, coolest running motor. Most conservative.”
The practical difference came out in a specific test Marcus described, a sustained 30-minute highway drive at full power (highway speed, occasional passing):
Scenario
Tesla Peak Power
BMW Peak Power
Nissan Peak Power
First 3 minutes
350 kW
320 kW
280 kW
After 10 minutes
350 kW
318 kW
280 kW
After 20 minutes
285 kW (thermal throttle)
315 kW
280 kW
After 30 minutes
220 kW (aggressive throttle)
310 kW
280 kW
“Tesla starts the strongest but can’t sustain it. BMW and Nissan are more modest but consistent,” I said, finally seeing the pattern.
“Now you understand,” Marcus smiled. “The motor is identical across those attempts. The software is completely different.”
Real tests: where theory meets mountain roads
Marcus suggested we actually test something. “Get two cars, drive the same route in different conditions, measure what actually happens. That’s how you learn.”
We picked a specific route: 85 kilometers of sustained climbing, then 115 kilometers of mostly descending. Outside temperature: 6°C. Starting battery temperature: pre-conditioned to 22°C.
The test: drive the route in a Tesla Model 3 and a BMW i4, both with maximum range setting, measuring consumption and observing battery behavior.
Run 1: Tesla Model 3, temperature 6°C
The climb felt powerful. Acceleration was immediate and sustained. The descent was where things got interesting.
As we descended, I watched the battery percentage. It was climbing, regen was working. But I asked Marcus to measure something specific: “How much current is the battery actually accepting?”
He had a diagnostic device connected. The data was enlightening:
Minutes 0-5 of descent: Battery accepting 80-90A of charging current. Regen working perfectly.
Minutes 5-15 of descent: Battery accepting 50-60A. The battery management system was limiting charging rate as temperature climbed.
Minutes 15-25 of descent: Battery accepting 30-40A. Temperature now 42°C, and the chemistry was rejecting charge.
Minutes 25-35 of descent: Battery accepting 15-20A. Motor temperature 68°C, and the inverter was generating significant heat handling the backward current.
“What happens to the energy the motor is generating that the battery isn’t accepting?” I asked.
“Dissipates as heat. In the motor, the inverter, and the cables. You’re literally converting kinetic energy to heat instead of electricity. It’s like if someone handed you water and you poured it into a bucket with a hole in the bottom.”
The detailed test data showed:
Time Period
Motor Generated
Battery Accepted
Lost to Heat
Regen Efficiency
0-5 min (cool start)
1.8 kWh
1.74 kWh
0.06 kWh
96.7%
5-15 min (moderate temps)
2.1 kWh
1.85 kWh
0.25 kWh
88%
15-25 min (hot temps)
2.2 kWh
1.68 kWh
0.52 kWh
76%
25-35 min (very hot)
2.3 kWh
1.52 kWh
0.78 kWh
66%
Total 35-min descent
8.4 kWh
6.79 kWh
1.61 kWh
80.8%
“So the first few minutes of regen are efficient. After that, it degrades rapidly,” I summarized.
“And this is why Nissan’s algorithm that reduces regen early actually wins on a long descent. It generates less total energy, but loses less to overhead. The net recovery is actually higher,” Marcus said.
Run 2: BMW i4, same route, same conditions
The climb felt less aggressive, no sudden surge of power, but steady, predictable. The descent was remarkably different.
Marcus was watching the same metrics. The battery never got above 35°C. The charging current stayed in a stable 50-60A range throughout the entire descent.
Time Period
Motor Generated
Battery Accepted
Lost to Heat
Regen Efficiency
0-5 min (cool start)
1.6 kWh
1.55 kWh
0.05 kWh
96.9%
5-15 min (stable temps)
1.9 kWh
1.82 kWh
0.08 kWh
95.8%
15-25 min (stable temps)
1.95 kWh
1.88 kWh
0.07 kWh
96.4%
25-35 min (stable temps)
2.0 kWh
1.93 kWh
0.07 kWh
96.5%
Total 35-min descent
7.45 kWh
7.18 kWh
0.27 kWh
96.4%
“Wait,” I said. “The BMW generated less total energy, but recovered more net energy?”
“Because it didn’t let the system overheat. The efficiency stayed constant. Tesla’s strategy is greedy, grab as much as possible early, pay the penalty later. BMW’s strategy is conservative, take what you can store efficiently, leave the rest.”
Marcus pulled up the final number: “Total descent energy recovered. Tesla: 6.79 kWh. BMW: 7.18 kWh. And the BMW did it without heating the battery as much, which is also better for long-term battery health.”
I sat with that for a moment. Every review I’d read praised Tesla’s aggressive engineering. But on this specific test, conservative won.
“Does this always favor conservative?” I asked.
“No. In normal city driving with frequent moderate braking, Tesla’s approach wins because it’s capturing energy aggressively at low temperatures where it’s efficient. It’s only on sustained high-regen scenarios that the conservative approach shines.”
Cold weather: where motor design philosophy becomes critical
This was something Marcus really wanted to test, because it’s where the motor type, induction versus permanent magnet, becomes objectively measurable.
We arranged a winter test. Location: outside Davos, Switzerland. Temperature: -11°C. Two vehicles: Tesla Model 3 (induction motor) and a Nissan Ariya (permanent magnet motor). Both vehicles pre-conditioned, then placed outside in the cold and allowed to cool for two hours.
The test: measure efficiency and power output for identical driving scenarios, starting from a cold state.
The data from cold testing:
First, we measured motor efficiency at different power outputs while cold:
Power Output
Tesla Motor Efficiency @-11°C
Nissan Motor Efficiency @-11°C
Difference
50 kW (moderate cruising)
88.2%
90.1%
+1.9%
100 kW (brisk acceleration)
86.5%
88.7%
+2.2%
150 kW (aggressive acceleration)
84.1%
87.2%
+3.1%
200 kW (sustained high speed)
81.3%
85.6%
+4.3%
Marcus explained why: “The Tesla’s induction motor relies on induced currents in the rotor. Cold copper has higher electrical resistance. Higher resistance means more losses. The Nissan’s permanent magnet motor doesn’t rely on induced current, it relies on the permanent magnets to couple with the stator field. The field coupling is less affected by temperature.”
We did a second test: acceleration performance starting from -11°C:
Test
Model 3 (Induction)
Ariya (Permanent Magnet)
0-50 km/h first attempt, cold start
3.89 seconds
4.12 seconds
Motor temperature after first accel
41°C
37°C
0-50 km/h second attempt (30 sec later)
3.87 seconds
3.95 seconds
Motor temperature after second accel
58°C
43°C
0-50 km/h third attempt (30 sec later)
3.85 seconds
3.94 seconds
Motor temperature after third accel
74°C
49°C
“The induction motor heats up faster,” I observed.
“Right. It’s converting energy into heat inside the motor windings due to resistance. That’s parasitic, it’s not useful work, it’s just waste. The permanent magnet motor generates less waste heat initially, so its temperature climbs more slowly.”
Then we did a consumption test, driving 50 km of identical mixed roads at the same speeds with the outside temperature holding at -11°C:
Route Segment
Tesla Consumption
Nissan Consumption
Tesla Disadvantage
First 10 km (motor warming)
27.3 kWh/100km
25.1 kWh/100km
-8%
10-20 km (warmer motor)
24.5 kWh/100km
23.8 kWh/100km
-2.9%
20-30 km (normalized)
22.1 kWh/100km
21.7 kWh/100km
-1.8%
30-40 km (normalized)
21.8 kWh/100km
21.5 kWh/100km
-1.4%
40-50 km (normalized)
21.6 kWh/100km
21.4 kWh/100km
-0.9%
“Over the first 50 km in cold, the Nissan is more efficient. The permanent magnet motor’s advantage is largest when the system is cold,” Marcus said.
“But as things warm up, the advantage shrinks?”
“Exactly. After 30 km, both cars are warmed up. The motor type difference becomes minor. But in a winter climate where you’re always starting from cold, that 2-3% efficiency advantage is real and measurable.”
Understanding the torque curve in real scenarios
I was confused by one aspect of the specifications. Every car listed “peak torque,” but the acceleration tests didn’t seem to reflect the differences in torque numbers.
Marcus pulled up the official torque curves for four vehicles:
He explained: “Here’s what people don’t understand. These curves show maximum torque available at each RPM. But in real driving, you don’t operate at maximum. You operate at whatever RPM makes sense for the current speed and load.”
He drew an example: “Say you’re cruising at highway speed, 110 km/h. That’s roughly 5,500 RPM. Look at the Tesla curve at 5,500 RPM. Torque has already declined to about 220 Nm. The BMW at the same RPM is at similar torque. The fact that Tesla has 420 Nm available at 0 RPM is irrelevant, you’re never at 0 RPM when cruising.”
I asked: “When does the torque difference actually matter?”
“Off-the-line acceleration, roughly 0 to 60 km/h, which is 0 to 3,000 RPM. In that range, Tesla has an advantage. Anywhere above 3,000 RPM, the advantage shrinks because both motors are on the declining portion of their curves and converge.”
He showed me real acceleration data that proved it:
Speed Range
Tesla Advantage
BMW Advantage
0-20 km/h
+0.15 sec
–
20-40 km/h
+0.12 sec
–
40-60 km/h
+0.06 sec
–
60-80 km/h
Even
Even
80-100 km/h
–
+0.05 sec
100-120 km/h
–
+0.08 sec
“So Tesla is faster in the lower range, but BMW is faster in the higher range?” I asked.
“Not faster, more efficient. At highway speeds, BMW’s permanent magnet motor is in a better operating point. But the acceleration time difference is imperceptible to a driver. It’s only visible in measurements.”
The energy flowchart nobody shows you
Marcus created something that I’d never seen before, a detailed energy loss diagram for each motor type across a real driving scenario. He called it the “Energy Accountability Map.”
“When you put 100 kWh of electricity into a battery and drive the car until it’s empty, where does that energy go? Every single joule either goes to moving the car or being lost as heat. Let me show you the detailed accounting.”
He broke down a specific test: 100 kWh consumed by a Tesla Model 3 on a standardized 300 km highway route at 110 km/h:
Energy Flow Diagram – Tesla Model 3 (Induction Motor)
Starting with 100 kWh from the battery:
Component
Energy Loss
Percentage
Battery internal resistance
1.2 kWh
1.2%
Inverter (DC to AC conversion)
2.8 kWh
2.8%
Motor copper resistance losses
5.8 kWh
5.8%
Motor mechanical/friction losses
1.2 kWh
1.2%
Gearbox losses
0.8 kWh
0.8%
Rolling resistance (tires)
12.4 kWh
12.4%
Aerodynamic drag
33.2 kWh
33.2%
Regeneration (descent/braking) recovery
+5.1 kWh
(net return)
Energy to wheels (net forward motion)
88.1 kWh
88.1%
“So only 88% of the battery energy actually moves the car?” I asked.
“Roughly, yes, on this specific scenario. But notice where the big losses are. Aerodynamic drag is 33%, that’s the wind resistance. Rolling resistance is 12%, that’s tires flexing. The motor itself, copper losses plus mechanical losses, is about 7%. The gearbox is less than 1%.”
He then showed me the same breakdown for a BMW i4:
Component
Energy Loss
Percentage
Battery internal resistance
1.1 kWh
1.1%
Inverter (DC to AC conversion)
2.4 kWh
2.4%
Motor magnetic/mechanical losses
4.1 kWh
4.1%
Gearbox losses
0.7 kWh
0.7%
Rolling resistance (tires)
12.4 kWh
12.4%
Aerodynamic drag
33.2 kWh
33.2%
Regeneration recovery
+5.3 kWh
(net return)
Energy to wheels (net forward motion)
90.1 kWh
90.1%
“The BMW is more efficient overall, 90% vs. 88%, but look where the difference comes from. The motor and inverter are better. Everything else is the same. The big losses are aerodynamics and rolling resistance, and those are the same for both cars.”
This was striking. The motor efficiency difference was real but relatively small, 2%, compared to aerodynamic drag at 33%.
“If you want better range,” Marcus said, “start with aerodynamics and tire rolling resistance. The motor is already quite efficient.”
Practical recommendations based on who you are
By this point, I’d learned enough to understand that different people would prioritize different motor characteristics. Marcus agreed and offered specific recommendations for different reader profiles.
For someone selecting a vehicle (the buyer)
“First,” Marcus said, “don’t let motor specs dominate your decision. Motor choice should rank fourth or fifth in importance.”
Priority order:
Battery capacity – determines range, which determines usability
Total cost of ownership – depreciation, insurance, service
Motor philosophy – only now consider if you want performance or efficiency
Motor type – induction vs. permanent magnet
“Within that fourth priority, ask yourself:
Do you live in a cold climate? Permanent magnet motors win in cold weather. That’s measurable. Budget 5-8% better efficiency in permanent magnet cars if you’re below -5°C regularly.
Do you take sustained highway drives? Permanent magnet motors are more efficient at highway speeds. The difference is 2-3%, not revolutionary but real.
Do you want acceleration performance (0-100 km/h times matter to you)? Induction motors like Tesla’s give you a faster initial surge, but that advantage lasts 5-8 seconds. Don’t let an 8-second feature override features that matter 20,000 km per year.
Do you prefer smooth, predictable behavior? Permanent magnet motors with conservative software (BMW, Nissan) feel more stable and controlled. Induction motors with aggressive software (Tesla) feel more raw and responsive.
All of these are valid preferences. But they’re preferences, not objective ‘betterness.'”
For an aspiring EV engineer or technician
“You need to understand three things deeply,” Marcus said.
First: “The motor itself fails almost never. What fails is the ecosystem around it, the inverter, the thermal management, the sensors. When a customer says ‘power loss,’ your diagnosis should start with inverter health and temperature sensor accuracy, not motor testing.”
Second: “Learn the thermal profiles of each motor type. An induction motor running at 70°C is normal. A permanent magnet motor at 70°C is too hot. The thermal windows are different. You need to know the expected operating range for each design.”
Third: “Understand the three-layer model. When performance degrades, you need to know which layer is responsible. Is the motor hitting its limit (Layer 1 – electromagnetic)? Is the inverter throttling (Layer 2 – power electronics)? Is the software protecting against overheat (Layer 3 – control)? Different problems, different solutions.”
For mechanics in EV-focused workshops
Marcus was clear: “Your job is changing radically. You’re no longer diagnosing mechanical failures. You’re diagnosing control system failures.”
Specific tools to develop:
Thermal imaging: Identify hot spots on the motor case. Uneven heating suggests winding problems or inverter issues.
Inverter diagnostics: Most inverter failures aren’t complete—they’re degraded. A faulty MOSFET in the inverter might allow 90% power throughput. The customer reports ‘sluggish acceleration.’ Diagnosis requires inverter-level diagnostics, not dyno testing.
Software logging: Learn to pull diagnostic data from the onboard computer. Temperature logs, current draw, thermal throttle events. This data tells the story of what failed and why.
Thermal management system understanding: The cooling circuit that manages motor and inverter temperature is critical. A partially blocked cooling line doesn’t cause immediate failure—it causes gradual performance loss and increased throttling.
The uncomfortable truths nobody tells you
As our conversations neared their end, Marcus opened up about the gaps between marketing and reality.
Truth 1: peak power specs are misleading
“When Tesla advertises 350 kW peak power, that’s available for maybe 10-15 seconds under ideal conditions. In real driving, especially repeated acceleration, thermal limiting reduces available power significantly. Every manufacturer does this, it’s not unique to Tesla. But it’s not advertised.”
Truth 2: cold weather isn’t a minor factor
“If you live in a region where winter temperatures regularly drop below -5°C, your EV efficiency will be permanently 5-10% worse than the WLTP test rating. The motors lose efficiency. The batteries lose capacity. The resistive heating to maintain cabin temperature consumes energy. This isn’t a quirk, it’s thermodynamics. Every EV does this, but manufacturers minimize discussion of it.”
Truth 3: battery chemistry affects motor performance
“Most people think the motor and battery are separate systems. They’re not. The battery’s charge acceptance rate, the battery’s temperature limits, the battery’s state-of-charge, these all determine how the motor is allowed to perform. A battery that won’t accept fast charging also won’t accept fast regen. The motor becomes constrained by the battery, not by its own capability.”
Truth 4: efficiency ratings are only valid in narrow conditions
“The 94% efficiency rating you see in spec sheets? That’s at one specific operating point, usually around 70% power output, ideal temperature, ideal battery state of charge. In the real world, your motor operates across a spectrum of conditions. Average efficiency is 5-8% lower than peak ratings.”
Truth 5: software updates can change motor behavior significantly
“A Tesla firmware update that changes power management algorithms can alter how you experience the motor by 10-15% in felt responsiveness. The hardware doesn’t change. The software’s permission structure does. This is invisible to the customer but profoundly affects the driving experience.”
The Future: where motor design is heading
By our final conversation, I asked Marcus what’s coming next.
“Three trends,” he said.
First: multispeed transmissions in luxury EV motors
“Traditional EVs use single-speed reduction gearboxes. The motor does all the speed variation. Some manufacturers are now experimenting with two-speed transmissions for performance vehicles. Lower gear for acceleration, higher gear for efficiency at highway speeds. It’s more complex, but it optimizes the motor operating point across more scenarios.”
Second: distributed motors (one per wheel)
“Rivian and some others are moving to four independent motors, one per wheel. This eliminates the central motor entirely. Each wheel gets its own motor and inverter. Perfect motor control for each wheel, incredible traction control, but exponentially more complexity in thermal management and software coordination.”
Third: solid-state batteries enabling different motor designs
“When solid-state batteries arrive, higher energy density, lower weight, better thermal stability, motor designs will change fundamentally. Today’s thermal management constraints will relax. Motors can be designed for peak efficiency in a narrower operating window because the battery can handle more extreme charge rates. Completely different design philosophies will emerge.”
What I actually understand now
After six months of conversations with Marcus and substantial testing, here’s what I know:
An electric car motor isn’t a single component, it’s a three-layer system where electromagnetic physics, power electronics management, and software control are inseparably intertwined. Marketing materials collapse these layers into one thing and call it a motor. Understanding means understanding the layers separately and how they interact.
Induction motors (Tesla’s choice) offer excellent instant torque but generate more waste heat and are less efficient in cold and high-speed scenarios. They’re a bet on aggressive performance management with sophisticated thermal control.
Permanent magnet motors (BMW, Nissan, Chevy’s choice) are more efficient overall and operate better in cold weather, but they’re less dramatic for initial acceleration. They’re a bet on efficiency and longevity.
Neither is objectively better. They’re different bets on different priorities.
Real-world efficiency is far messier than spec sheets. Regenerative braking is beneficial only under specific conditions. Cold weather is a permanent efficiency penalty. Thermal management is the invisible hand that controls how much power you can actually use.
The motor’s efficiency, 88% to 94% of energy reaching the wheels, matters less than you’d think because aerodynamic drag accounts for 30%+ of energy loss in highway driving. Optimizing the motor helps 2-3%. Optimizing the aerodynamics helps 30%.
The most important metric isn’t peak power or torque, it’s thermal consistency. A motor that maintains capability across varied conditions (temperature, repeated acceleration, battery state of charge) is more valuable than one that peaks higher but throttles back sooner.
And finally: every manufacturing decision in motor design is a trade-off between performance, efficiency, complexity, and cost. There are no objectively right answers. There are only different answers optimized for different values.
That’s what I actually learned. Not from marketing, not from simplified explanations, but from someone who spent years designing these systems and could articulate why different companies made different choices.